Quick Start Guide
This guide walks you from unboxing to your first measurement. The whole process takes about ten minutes, most of which is calibration.
Charge the battery
Section titled “Charge the battery”-
Connect USB Type-C. Plug the included cable into the USB-C port on the top edge of the device. Use a standard 5 V USB charger (4.7 — 5.5 V).
-
Watch the LED. The red LED illuminates and the blue LED flashes during charging. When the battery is full, the red LED turns off and the blue LED stays on solid.
-
Wait for a full charge. A depleted battery takes a few hours to reach full capacity. The 4500 mAh cell provides roughly five hours of continuous use.
Power on
Section titled “Power on”-
Long-press the power button. Hold the leftmost physical button for about two seconds. The display shows a boot splash, then the main sweep screen appears.
-
Check the battery icon. The battery indicator in the top-right area of the screen shows remaining charge. If it is very low, charge before calibrating.
Understand the main screen
Section titled “Understand the main screen”The main display is divided into distinct regions. Getting familiar with these helps you read measurements quickly.
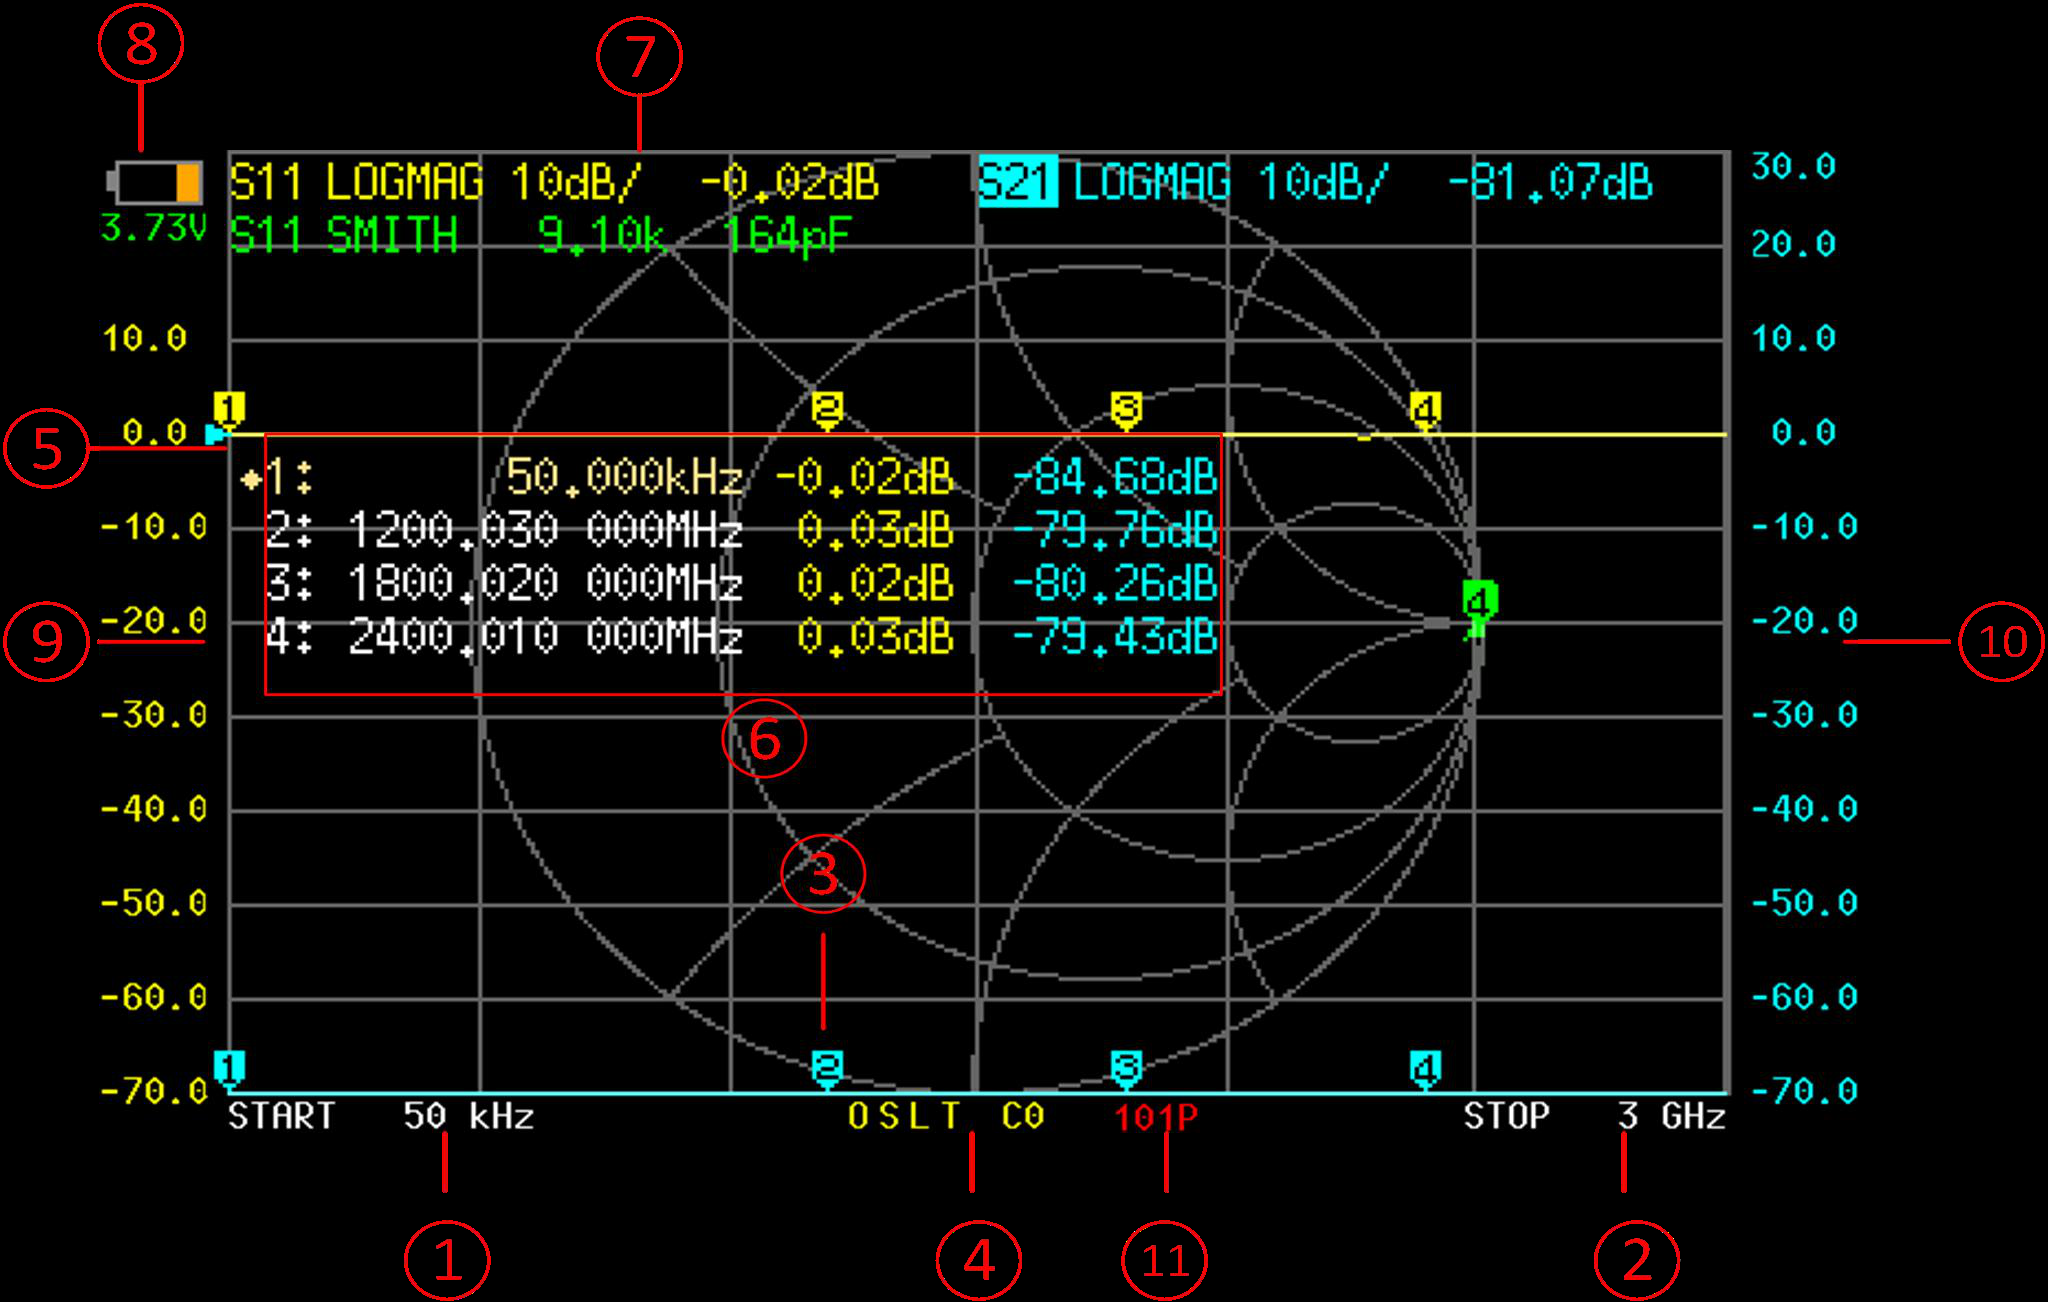
Shows the currently active channel (CH0 or CH1), stimulus settings, and trace labels.
Tap here to open the navigation menu. Gives access to stimulus, calibration, display, marker, and configuration settings.
The horizontal reference line for each trace. Its position corresponds to the reference value shown in the scale area.
The main plotting region where S11 and S21 traces are drawn across the frequency span.
Displays the frequency and measured value for each active marker.
The horizontal axis showing start, center, and stop frequencies of the current sweep.
Shows the vertical scale per division and reference value for each trace.
Indicates calibration state: C0--C6 codes show which calibration steps have been applied.
Battery charge level and charging state icon.
Numbered markers positioned along the trace at their set frequencies.
Shows sweep progress, averaging count, and other operational status.
Connect the calibration standards
Section titled “Connect the calibration standards”Before any measurement is meaningful, you need to calibrate. Calibration removes systematic errors from the cables, connectors, and instrument internals.
-
Attach cables to both ports. Connect the included SMA-JJ RG405 cables to PORT1 and PORT2. Finger-tighten the SMA connectors — do not use a wrench on the device ports.
-
Set the frequency range. Tap the menu area, navigate to STIMULUS, and set the start and stop frequencies for your measurement. For a first test, try 1 MHz to 900 MHz.
-
Open the calibration menu. Navigate to CAL > CALIBRATE in the menu system.
-
Perform OPEN calibration. Leave the free end of the PORT1 cable disconnected (or attach the Open standard from the cal kit). Select OPEN in the calibration menu and wait for the sweep to complete.
-
Perform SHORT calibration. Attach the Short standard to the PORT1 cable. Select SHORT and wait for the sweep.
-
Perform LOAD calibration. Attach the 50-ohm Load standard to the PORT1 cable. Select LOAD and wait for the sweep.
-
Perform THRU calibration. Connect the free ends of the PORT1 and PORT2 cables directly together. Select THRU and wait for the sweep.
-
Perform ISOLATION calibration (optional). With the Load standard on PORT1 and nothing on PORT2 (or a second Load if available), select ISOLN. This step is optional but improves S21 accuracy at low signal levels.
-
Apply and save. Select DONE to apply the calibration. Then save it to one of the 12 storage slots via CAL > SAVE so you can recall it later.
Make your first measurement
Section titled “Make your first measurement”With calibration done, you are ready to measure a device.
-
Connect the DUT. For a reflection measurement (S11), connect your device under test — an antenna, for example — to the free end of the PORT1 cable. For a transmission measurement (S21), connect the DUT between the PORT1 and PORT2 cables.
-
Read the traces. The default traces typically show return loss (S11 in LogMag) and phase. Look for the frequency where return loss is deepest — that is the resonant point of an antenna, or the center frequency of a filter.
-
Place a marker. Tap on the trace to drop a marker, or use MARKER > SELECT MARKER to activate one and set its frequency. The marker readout area at the top of the screen displays the exact frequency and measured value.
-
Adjust the view. Use DISPLAY > SCALE to zoom in on regions of interest. Change the display format (LogMag, SWR, Smith chart, etc.) via DISPLAY > FORMAT to see the data in different ways.
Next steps
Section titled “Next steps”- Hardware Overview — Learn about the physical controls, ports, and LED indicators in detail.
- VNA Basics — Understand S-parameters, calibration theory, and what the numbers actually mean.
- Full Calibration Tutorial — A thorough walkthrough of all calibration methods and best practices.