Display Formats
The NanoVNA-F V3 offers 13 display formats. Each format presents the same underlying measurement data in a different way, suited to different analysis tasks.
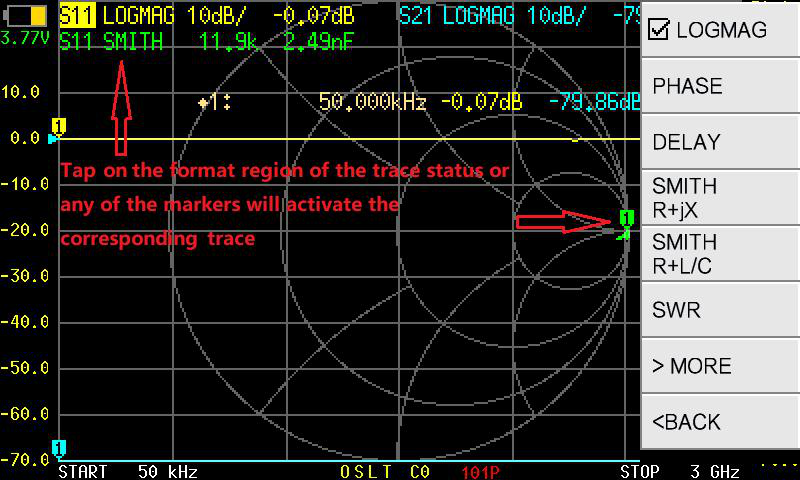
Change the display format
Section titled “Change the display format”- Activate the trace you want to change.
- Tap .
- Select the desired format from the list.
Format reference
Section titled “Format reference”Magnitude and loss
Section titled “Magnitude and loss”| Format | What it shows | When to use it |
|---|---|---|
| LOGMAG | Magnitude in dB (logarithmic) | Return loss, insertion loss, filter response — the most common general-purpose format |
| LINEAR | Magnitude as a linear ratio (0 to 1) | Comparing voltage ratios directly |
| SWR | Standing wave ratio (1:1 and up) | Antenna matching — quickly see how close to 50 ohm you are |
Phase and delay
Section titled “Phase and delay”| Format | What it shows | When to use it |
|---|---|---|
| PHASE | Phase angle in degrees (-180 to +180) | Phase response of filters, transmission lines |
| DELAY | Group delay in seconds | Evaluating signal delay through a device or cable |
Impedance
Section titled “Impedance”| Format | What it shows | When to use it |
|---|---|---|
| SMITH R+jX | Smith chart with resistance and reactance readout | Impedance matching, tuning networks |
| SMITH R+L/C | Smith chart with resistance and equivalent inductance or capacitance | Identifying reactive components at a given frequency |
| RESISTANCE | Real part of impedance (ohms) vs. frequency | Seeing resistive component on a Cartesian plot |
| REACTANCE | Imaginary part of impedance (ohms) vs. frequency | Seeing reactive component on a Cartesian plot |
Complex representation
Section titled “Complex representation”| Format | What it shows | When to use it |
|---|---|---|
| POLAR | Magnitude and phase on a polar plot | Visualizing reflection coefficient as a vector |
| REAL | Real part of the complex S-parameter | Advanced analysis of in-phase component |
| IMAG | Imaginary part of the complex S-parameter | Advanced analysis of quadrature component |
Quality
Section titled “Quality”| Format | What it shows | When to use it |
|---|---|---|
| Q FACTOR | Quality factor vs. frequency | Evaluating resonator or inductor quality |