Main Screen Regions
The NanoVNA-F V3 main screen packs eleven distinct information regions into its 4.3-inch display. Knowing what each area shows — and how to interact with it — is essential for efficient operation.
Region Reference
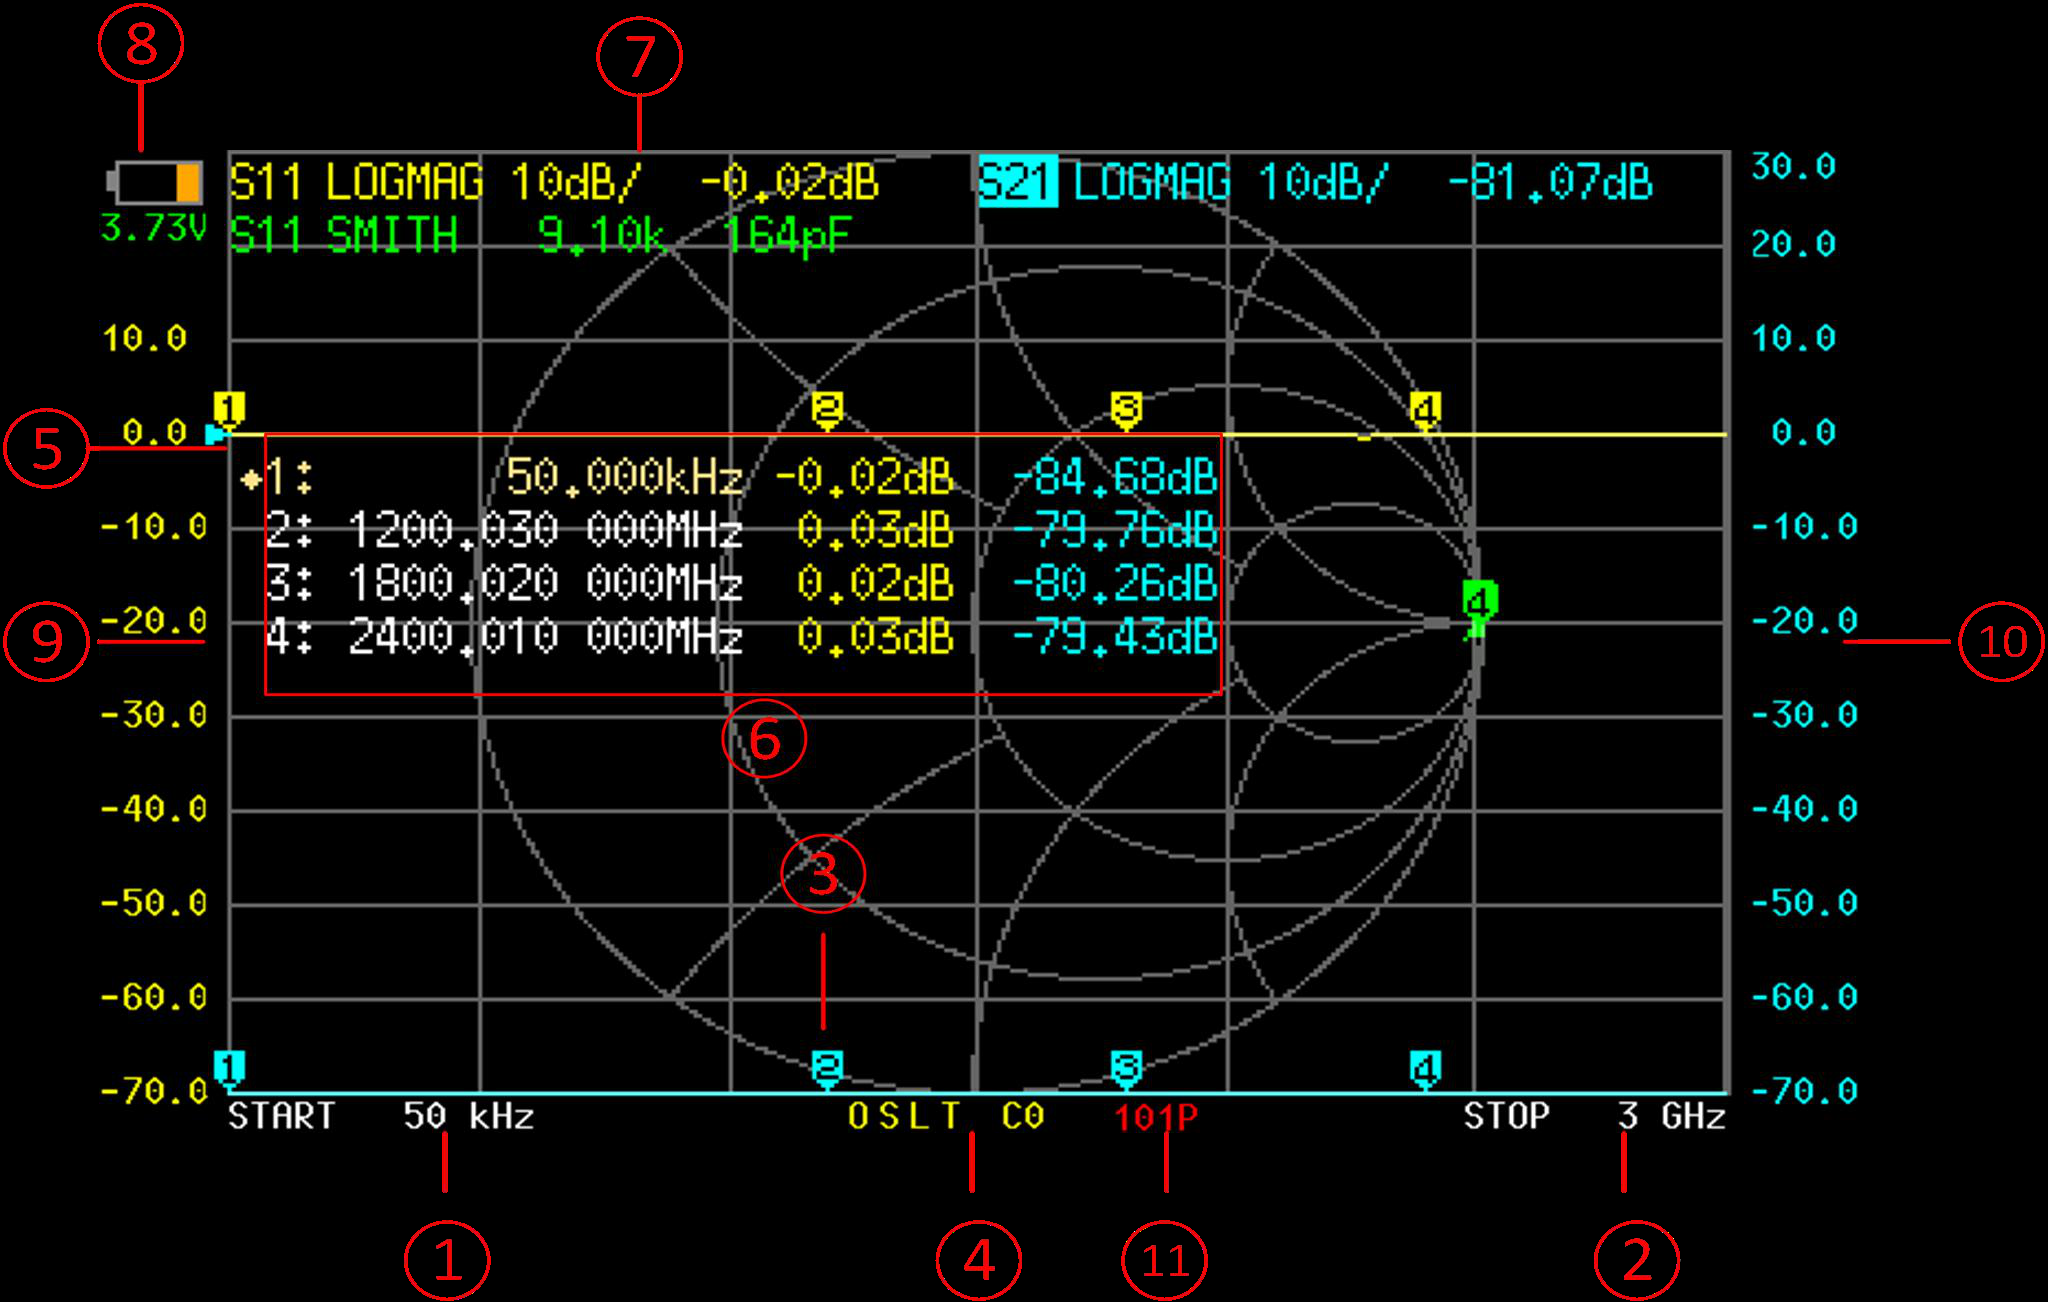
Section titled “Region Reference”Displays the current sweep start frequency. Tap this area to open the virtual keyboard and set a new start frequency directly, bypassing the STIMULUS menu.
Displays the current sweep stop frequency. Like the start frequency area, tapping here opens the keyboard for quick entry. When using center/span mode, this area shows the span value instead.
Up to four markers can appear on the trace simultaneously. The active marker is indicated by a diamond shape. Move the active marker by pressing the UP/DOWN buttons, or drag it directly on the touchscreen (a stylus is recommended for precision). Tap any marker on the trace to activate it.
Shows the current calibration state using a compact code string. Common indicators: O (open done), S (short done), L (load done), T (thru done), C (calibrated), * (not saved), c (interpolated), and Cn where n is the save slot number (0-12). See the Calibration Status Codes reference for full details.
Small triangular marker on the left edge indicating the reference level (0 dB, 0 degrees, etc.) for the corresponding trace. The default position is 7, counting from the bottom gridline (0) to the top (10). Change via DISPLAY > REF POS.
Displays frequency and measurement values for all active markers. Each row shows the marker number, frequency, and two parameter readings. The diamond symbol indicates the active marker. Tap a row's frequency value to activate that marker. The table can be repositioned vertically via MARKER > SELECT > POSITION, or dragged by holding the value area for more than 0.5 seconds (when DRAG ON is enabled).
One line per active trace showing: channel (S11 or S21), format (e.g., LOGMAG), scale per division, and the value at the active marker frequency. For example, 'S21 LOGMAG 10dB/ 0.03dB' means the cyan trace is on S21, formatted as log magnitude, scaled at 10 dB per division, with a value of 0.03 dB at the marker. Tap the channel label to switch channels, tap the format to open the FORMAT menu, or tap the scale to open SCALE and REF POS.
Shows the current lithium battery voltage. A fully charged battery reads approximately 4.2 V. Charge the device when the reading drops below 3.3 V to avoid unexpected shutdown.
The vertical axis label on the left side of the graph. This always corresponds to trace 0, regardless of which trace is currently active. Tap this area to quickly open the scale settings for trace 0.
The vertical axis label on the right side of the graph. This corresponds to whichever trace is currently active. Tap this area to quickly open the scale settings for the active trace.
Shows the current number of sweep points (between 11 and 801). More points provide finer frequency resolution at the cost of slower sweep speed. Configure via DISPLAY > SWEEP POINTS.
Touch Shortcuts
Section titled “Touch Shortcuts”Many screen regions double as touch shortcuts, reducing the number of menu taps needed for common adjustments:
| Tap Region | Action |
|---|---|
| START frequency (1) | Open keyboard to set start frequency |
| STOP frequency (2) | Open keyboard to set stop frequency |
| Marker on trace (3) | Activate that marker |
| Marker table row (6) | Activate the marker for that row |
| Trace status — channel (7) | Switch channel (S11/S21) |
| Trace status — format (7) | Open FORMAT menu |
| Trace status — scale (7) | Open SCALE / REF POS settings |
| Left ordinate (9) | Open scale settings for trace 0 |
| Right ordinate (10) | Open scale settings for active trace |