Your First S11 Measurement
An S11 measurement tells you how much signal bounces back from a device connected to PORT1 — the “reflection coefficient.” This is the single most common measurement in antenna work: it reveals impedance, SWR, and resonant frequency all at once.
In this tutorial you will connect an antenna (or any single-port device) to the NanoVNA-F V3 and take your first S11 reading.
What you will need
Section titled “What you will need”- NanoVNA-F V3, charged or USB-powered
- SMA calibration kit (OPEN, SHORT, LOAD) included with the unit
- SMA-JJ RG405 cable (included)
- An antenna or other device with an SMA connector (or an appropriate adapter)
Setting up the measurement
Section titled “Setting up the measurement”-
Power on the NanoVNA-F V3
Long-press the power button until the screen lights up. The default display shows two traces: S11 LOGMAG on the top half and S11 Smith chart on the bottom.
-
Set the frequency range
Tap the screen to bring up the menu. Navigate to STIMULUS and set START and STOP frequencies to bracket your antenna’s expected operating range. For a 2 m amateur band antenna, try 130 MHz to 160 MHz. For a 70 cm antenna, 400 MHz to 470 MHz.
-
Calibrate
A fresh calibration is essential for trustworthy results. At minimum, perform a one-port calibration (OPEN, SHORT, LOAD) at the end of the cable you will connect to the antenna.
Navigate to CAL and follow the OPEN / SHORT / LOAD sequence, then tap DONE and SAVE to a slot.
See Full Calibration for the complete procedure.
-
Connect your antenna
Attach the antenna (or adapter + antenna) to the end of the cable where you just calibrated. The calibration reference plane is at that connector, so measurements will be most accurate there.
-
Read the results
The sweep runs continuously. You should see the S11 trace update in real time.
Understanding the S11 display
Section titled “Understanding the S11 display”The default screen shows two display formats for S11:
LOGMAG (Return Loss)
Section titled “LOGMAG (Return Loss)”The LOGMAG trace shows return loss in dB. Key values to know:
| S11 LOGMAG | Return Loss | SWR (approx.) | Meaning |
|---|---|---|---|
| 0 dB | None | Infinite | Total reflection — open or short circuit |
| -6 dB | 6 dB | 3.0:1 | Poor match |
| -10 dB | 10 dB | 1.9:1 | Acceptable for many applications |
| -15 dB | 15 dB | 1.4:1 | Good match |
| -20 dB | 20 dB | 1.2:1 | Very good match |
Smith Chart
Section titled “Smith Chart”The Smith chart plots impedance as a single point (per frequency). The center of the chart is 50 ohms — the ideal match. Points to the right indicate higher impedance, points to the left indicate lower. Movement above the center line means inductive reactance; below means capacitive.
Using a marker to read values
Section titled “Using a marker to read values”-
Tap the screen to open the menu, then navigate to MARKER and select MARKER 1.
-
Use SEARCH then MINIMUM to jump the marker to the deepest point on the S11 LOGMAG trace — this is typically the resonant frequency.
-
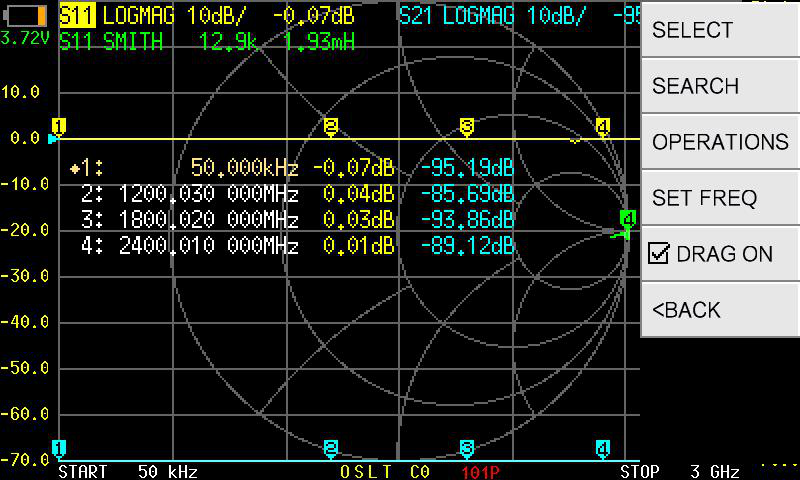
Read the marker readout at the top of the screen. It shows frequency and the value for each active trace (e.g., return loss in dB and impedance in R+jX format).
Switching to SWR display
Section titled “Switching to SWR display”If you prefer to read SWR directly rather than return loss:
-
Tap the trace status box in the upper-left area of the screen (it shows the current format, e.g. “LOGMAG”).
-
Select SWR from the format list.
-
The trace now shows SWR values. A marker on the trace will display the SWR ratio directly (e.g., 1.3:1).
Quick verification checklist
Section titled “Quick verification checklist”After calibration and before connecting your device under test, verify the calibration is good:
- OPEN on PORT1: S11 LOGMAG reads approximately 0 dB, Smith chart shows the marker at the far right.
- SHORT on PORT1: S11 LOGMAG reads approximately 0 dB, Smith chart shows the marker at the far left.
- 50-ohm LOAD on PORT1: S11 LOGMAG dips well below -30 dB, Smith chart shows the marker at the center.
If these checks do not pass, recalibrate before measuring your device.
Next steps
Section titled “Next steps”- Reading the Display — understand every region of the screen
- Your First S21 Measurement — measure through a two-port device
- Testing an Antenna — a full practical project with tips for different bands