Reading the Display
The NanoVNA-F V3 packs a lot of information onto its 4.3-inch screen. Once you know where to look, you can read frequency, calibration status, marker values, trace data, and battery level at a glance.
This page walks through every region of the main measurement screen.
Screen overview
Section titled “Screen overview”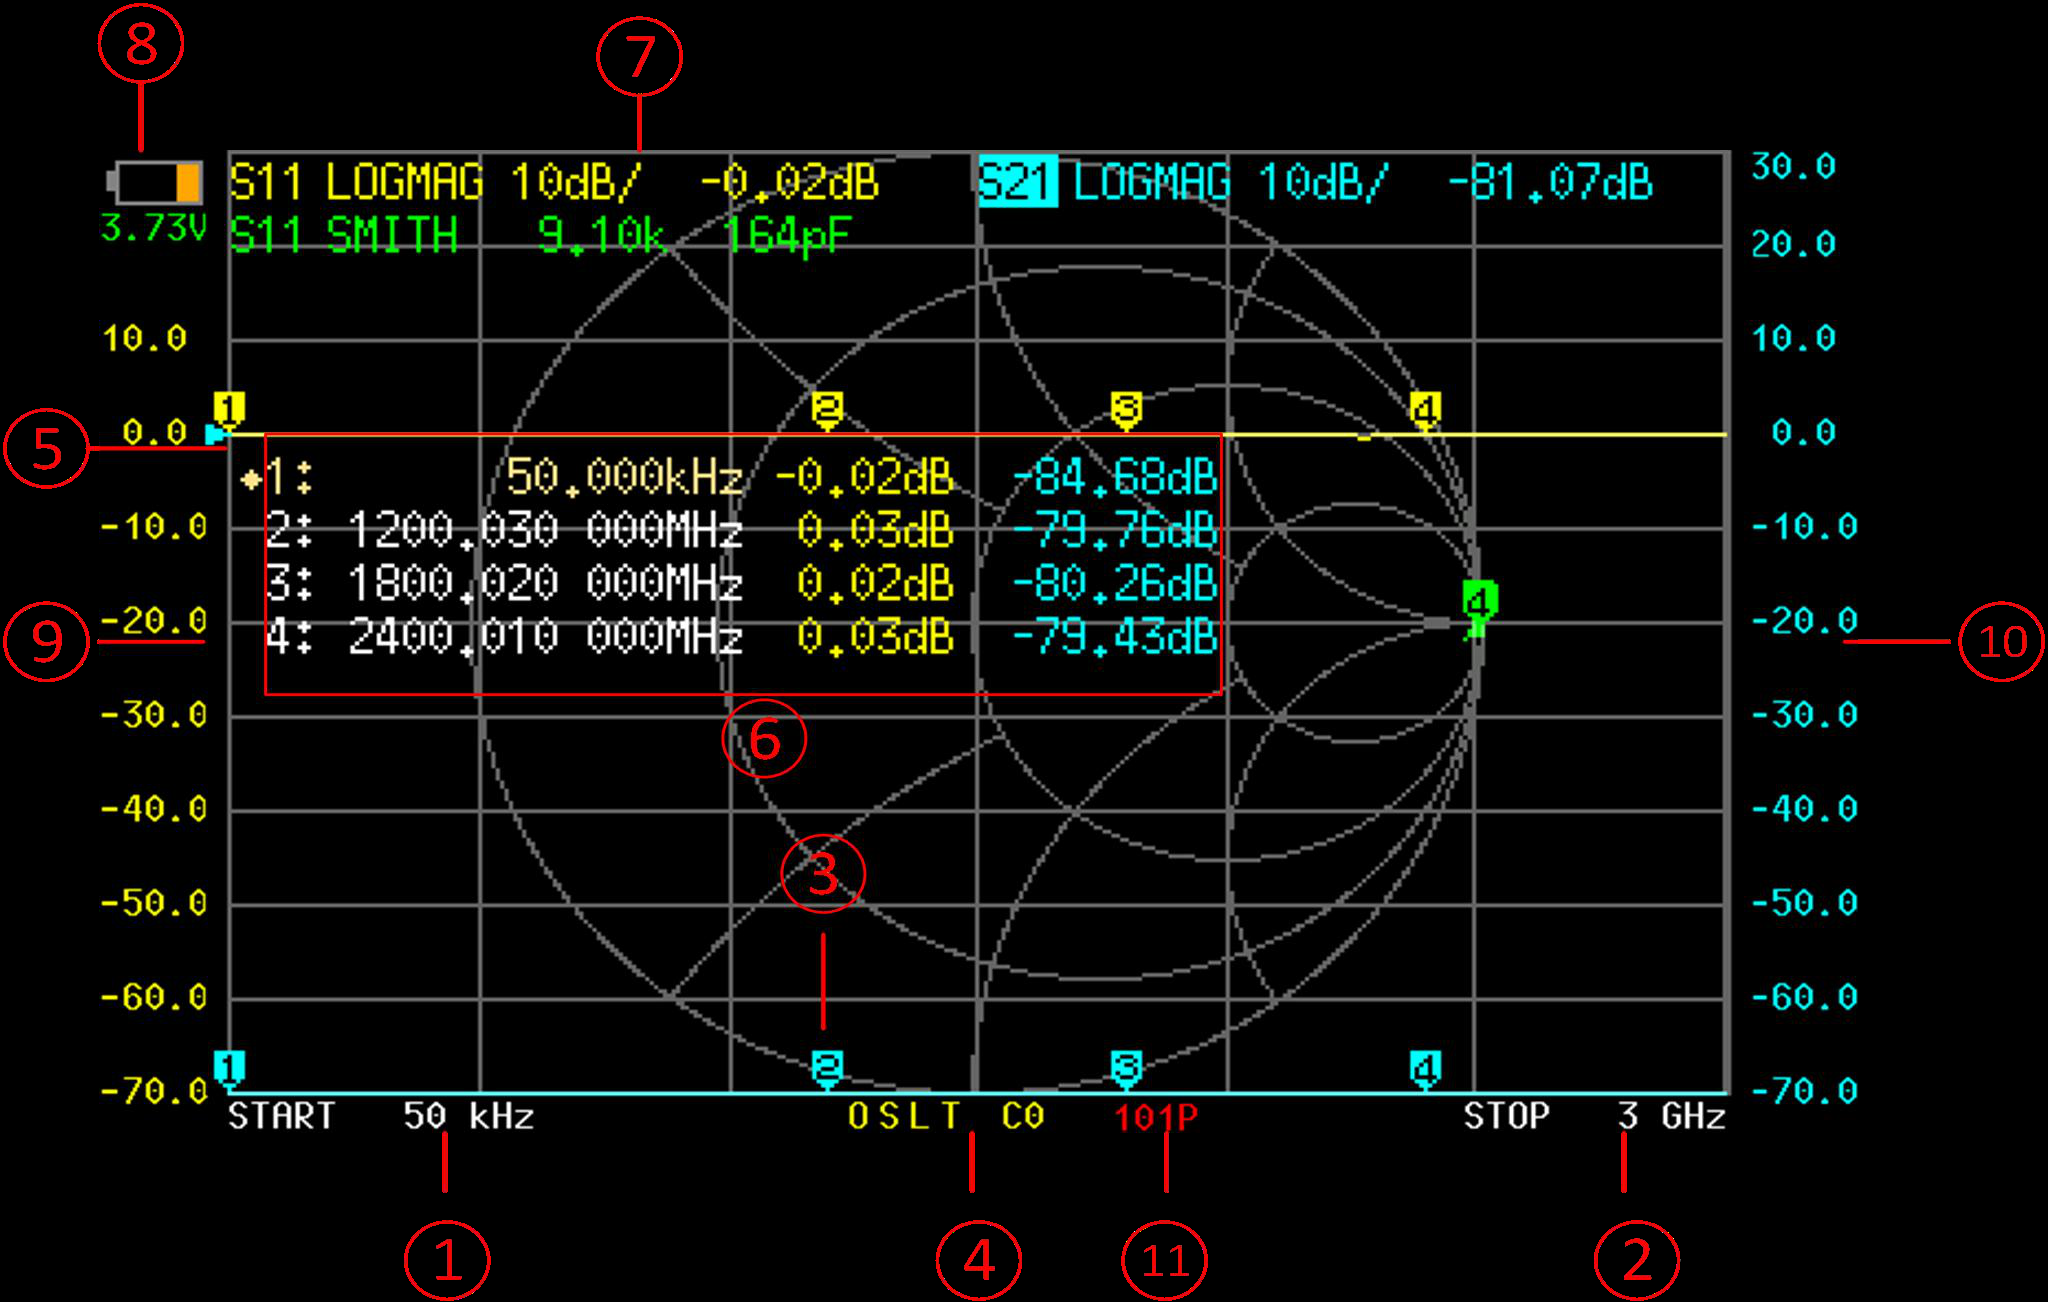
The main screen is divided into 11 distinct regions. Each one serves a specific purpose during measurements.
Displays the start frequency of the current sweep. This is the leftmost point on the horizontal axis. Tap the screen and navigate to STIMULUS to change this value.
Displays the stop frequency of the current sweep. This is the rightmost point on the horizontal axis. Together with the START frequency, these define the measurement span.
Shows the active marker's frequency and measured values. Each active trace contributes a line here -- for example, the marker might show return loss in dB on one line and impedance in R+jX format on another. The marker number and frequency appear at the top of this area.
Indicates the current calibration state. Characters appear as calibration standards are applied: O (Open), S (Short), L (Load), T (Through), C (corrected/active), and * (interpolated). For example, 'OSLT C0' means a full calibration from save slot 0 is active. See the Calibration Status Codes reference for all indicators.
A small triangle or indicator along the vertical axis marking the 0 dB (or other reference) position for the active trace. This is where the reference level sits on the display. You can move it via DISPLAY > SCALE > REFERENCE POSITION.
When multiple markers are active, this area shows a table with each marker's frequency and value. This lets you compare readings across several frequencies at once without switching between markers.
Located in the upper portion of the display, one box per active trace. Each shows the trace number, channel (S11 or S21), and display format (e.g., LOGMAG, SWR, SMITH). Tapping this area opens the format selection menu for that trace.
Displays the current battery voltage in the top-right corner. A fully charged NanoVNA-F V3 shows approximately 4.2V. The device will warn and shut down as voltage drops below safe levels.
The vertical scale labels on the left side of the chart. The units depend on the active display format: dB for LOGMAG, ratio for SWR, ohms for resistance, and so on. The scale per division is shown in the trace status box.
When a second trace uses a different format or scale, its vertical labels appear on the right side. This allows two traces with different units to share the same chart area.
Shows the number of measurement points in the current sweep (e.g., 101, 201, 401, or 1001). More points give finer frequency resolution but slower sweep updates. Adjust via STIMULUS > SWEEP POINTS.
Trace status box in detail
Section titled “Trace status box in detail”The trace status box (region 7) is one of the most interactive parts of the display.
Each box shows three pieces of information:
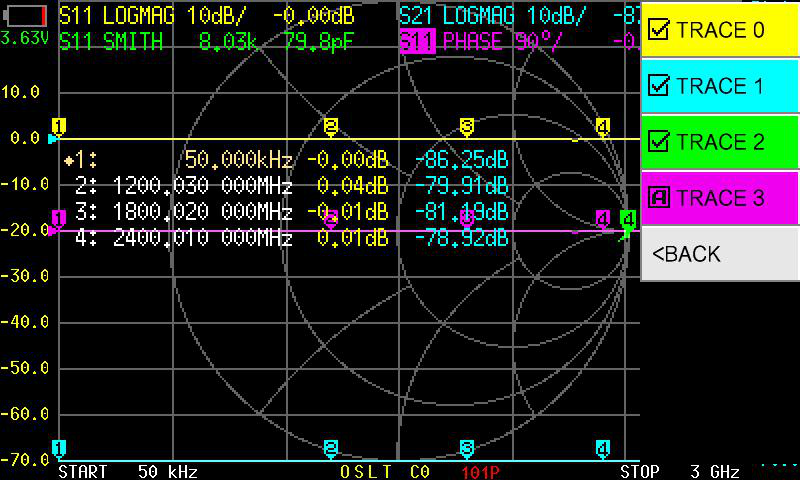
- Trace number (0-3) and its color coding
- Channel assignment — S11 (reflection, PORT1) or S21 (transmission, PORT1 to PORT2)
- Display format — LOGMAG, PHASE, SMITH, SWR, etc.
Trace colors
Section titled “Trace colors”The four traces are color-coded so you can tell them apart when multiple traces overlap on the chart:
| Trace | Default Color |
|---|---|
| TRACE 0 | Yellow |
| TRACE 1 | Blue |
| TRACE 2 | Green |
| TRACE 3 | Red |
Markers inherit the color of the trace they belong to. When you tap a marker on the chart, it activates the matching trace.
Calibration status indicators
Section titled “Calibration status indicators”Region 4 shows a compact string that tells you exactly what calibration state is active. The characters mean:
| Indicator | Meaning |
|---|---|
| O | Open standard applied |
| S | Short standard applied |
| L | Load standard applied |
| T | Through standard applied |
| C | Correction is active (calibration applied to measurements) |
| * | Calibration data is interpolated (current frequency range differs from calibration range) |
| c | Calibration active but with reduced accuracy |
| Cn | Correction active from save slot n (e.g., C0, C3) |
Reading marker values
Section titled “Reading marker values”The marker readout (region 3) changes depending on which display formats are active. Here are some common examples:
With S11 LOGMAG and S11 Smith active:
M1: 145.000 MHz -18.3 dB 48.2 + j3.1 ΩThis tells you marker 1 is at 145 MHz, the return loss is 18.3 dB, and the impedance is 48.2 ohms with 3.1 ohms of inductive reactance — close to a 50-ohm match.
With S21 LOGMAG active:
M1: 145.000 MHz -2.7 dBThis tells you the device has 2.7 dB of insertion loss at 145 MHz.
Display formats at a glance
Section titled “Display formats at a glance”The NanoVNA-F V3 supports 13 display formats. The most commonly used are:
| Format | What it shows | Typical use |
|---|---|---|
| LOGMAG | Magnitude in dB | Return loss, insertion loss |
| SWR | Standing wave ratio | Antenna matching |
| SMITH R+jX | Impedance on Smith chart | Impedance analysis, matching networks |
| PHASE | Phase angle in degrees | Phase response of filters, delay lines |
| DELAY | Group delay | Filter performance, cable characterization |
For the full list of formats and when to use each one, see Display Formats.
Next steps
Section titled “Next steps”- Your First S11 Measurement — put this knowledge into practice
- Configure Traces — set up multiple traces for simultaneous display
- Using Markers — get precise readings at specific frequencies