Measuring a Filter
Filters are among the most common two-port devices you will encounter in radio work. The NanoVNA-F V3 lets you see the complete frequency response of a filter in seconds — passband loss, bandwidth, rolloff steepness, and stopband rejection.
This tutorial walks through measuring a bandpass filter from start to finish. The same techniques apply to lowpass, highpass, and notch filters with minor adjustments.
What you will need
Section titled “What you will need”- NanoVNA-F V3, charged or USB-powered
- SMA calibration kit (OPEN, SHORT, LOAD)
- SMA-JJ RG405 cable (included)
- SMA straight-through adapter (included)
- A filter with SMA connectors (or appropriate adapters)
Choosing the frequency range
Section titled “Choosing the frequency range”Set your sweep to cover the filter’s passband plus enough margin to see the stopband behavior:
- Bandpass filter: Set START well below the passband and STOP well above it. For a 145 MHz bandpass filter, try 50 MHz to 300 MHz.
- Lowpass filter: Set START near DC (1 MHz is the NanoVNA minimum) and STOP at 2 to 3 times the cutoff frequency.
- Highpass filter: Set START below the cutoff and STOP well above the passband.
Calibrating for S21
Section titled “Calibrating for S21”A full OSLT calibration gives the best results for filter measurements. The THROUGH standard is especially important because it defines the 0 dB reference for the transmission path.
-
Navigate to STIMULUS and set the frequency range.
-
Navigate to CAL and perform the full calibration:
- Connect OPEN to PORT1 (or cable end). Tap OPEN.
- Connect SHORT. Tap SHORT.
- Connect LOAD. Tap LOAD.
- Connect PORT1 to PORT2 with the SMA-JJ cable or adapter. Tap THROUGH.
- Tap DONE, then SAVE to a slot.
-
Verify: with the THROUGH still connected, S21 LOGMAG should read approximately 0 dB across the span.
See Full Calibration for the detailed procedure.
Connecting the filter
Section titled “Connecting the filter”-
Remove the THROUGH connection between PORT1 and PORT2.
-
Connect the filter’s input to PORT1 (or the cable from PORT1).
-
Connect the filter’s output to PORT2 (or the cable going to PORT2).
-
The sweep updates immediately. You should see the filter’s frequency response on the S21 trace.
Setting up the display
Section titled “Setting up the display”For filter characterization, configure these traces:
| Trace | Channel | Format | Purpose |
|---|---|---|---|
| TRACE 0 | S21 | LOGMAG | Insertion loss / frequency response |
| TRACE 1 | S11 | LOGMAG | Input return loss (how well the filter is matched) |
| TRACE 2 | S21 | PHASE | Phase response (optional, useful for phase-critical applications) |
Navigate to DISPLAY > TRACE to activate and configure each trace.
Reading the S21 response
Section titled “Reading the S21 response”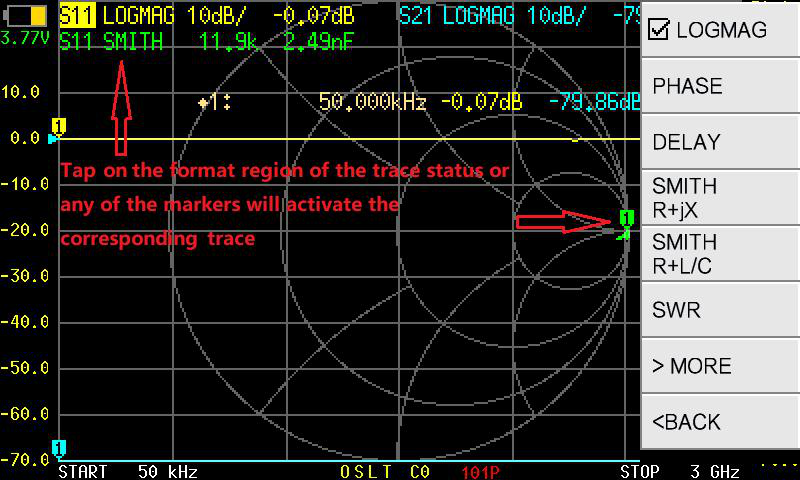
The S21 LOGMAG trace shows the filter’s transmission response:
Key features to identify
Section titled “Key features to identify”The frequency range where the filter lets signals through. On the LOGMAG trace, this is the highest (least negative) region. A perfect filter would show 0 dB here; real filters always have some insertion loss.
Passband insertion loss: Read the S21 value at the peak of the passband. Values of -0.5 to -3 dB are typical depending on filter type and quality. Lower loss is better.
Passband ripple: Look for variations in the passband level. A filter spec might say “0.5 dB ripple” — this means the passband level varies by up to 0.5 dB across its width.
The -3 dB bandwidth is the standard measure of a filter’s width. It is the frequency range where S21 stays within 3 dB of the passband peak.
For a bandpass filter, the bandwidth is:
BW = f_upper - f_lowerwhere f_upper and f_lower are the frequencies where S21 drops 3 dB below the peak.
The frequency range where the filter blocks signals. On the LOGMAG trace, this is the region far below the passband.
Stopband rejection: How many dB below the passband the filter attenuates unwanted signals. A filter with -40 dB stopband rejection removes 99.99% of the signal power at those frequencies.
Ultimate rejection: The deepest attenuation the filter achieves. This is limited by the filter’s isolation and, at very low levels, by the NanoVNA’s dynamic range (noise floor).
The steepness of the transition from passband to stopband. Steeper rolloff means the filter transitions more sharply. This is often described in dB per octave or dB per decade.
A filter with steep rolloff can separate closely spaced signals; one with gentle rolloff cannot.
Finding the -3 dB bandwidth with markers
Section titled “Finding the -3 dB bandwidth with markers”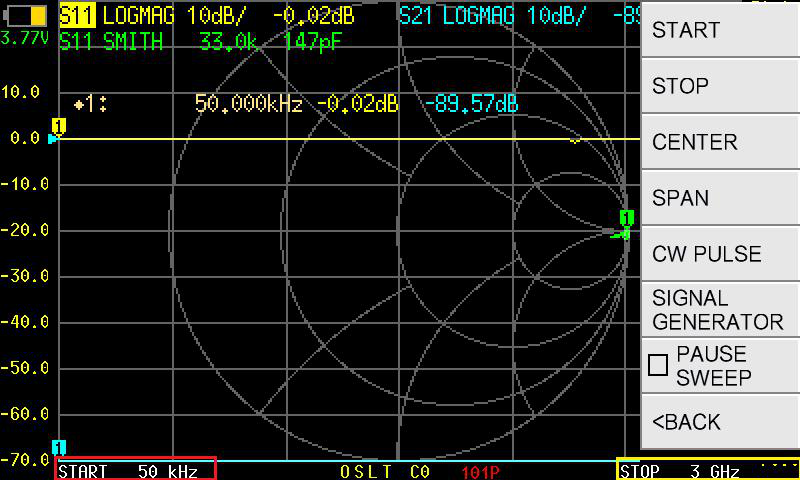
-
Place MARKER 1 at the passband peak.
Navigate to MARKER > SELECT > MARKER 1, then SEARCH > MAXIMUM. The marker jumps to the point of lowest insertion loss. Note the dB value (e.g., -1.2 dB).
-
Calculate the -3 dB level.
Subtract 3 dB from the peak value. If the peak is -1.2 dB, the -3 dB level is -4.2 dB.
-
Place MARKER 2 at the lower -3 dB point.
Activate MARKER 2. Manually move it (by tapping or dragging) to the frequency on the lower slope where the trace crosses your calculated -3 dB level. Alternatively, use the SEARCH > LEFT function to search leftward from the peak.
-
Place MARKER 3 at the upper -3 dB point.
Activate MARKER 3 and position it at the upper -3 dB crossing. Use SEARCH > RIGHT to search rightward.
-
Read the bandwidth.
The -3 dB bandwidth is the difference between MARKER 3’s frequency and MARKER 2’s frequency.
Evaluating filter quality
Section titled “Evaluating filter quality”Here are some benchmarks for common filter types:
| Parameter | Acceptable | Good | Excellent |
|---|---|---|---|
| Passband insertion loss | < 3 dB | < 1 dB | < 0.5 dB |
| Passband ripple | < 1 dB | < 0.5 dB | < 0.1 dB |
| Stopband rejection | > 20 dB | > 40 dB | > 60 dB |
| Input return loss (S11) | < -10 dB | < -15 dB | < -20 dB |
Checking input match (S11)
Section titled “Checking input match (S11)”A well-designed filter should present close to 50 ohms at its input within the passband. Activate the S11 LOGMAG trace to check:
- S11 below -15 dB in the passband means the filter is well matched and will not cause significant reflections in a 50-ohm system.
- S11 near 0 dB in the stopband is expected — the filter reflects (rejects) signals at those frequencies.
Troubleshooting
Section titled “Troubleshooting”Passband shows more loss than the filter is rated for
- Check connector tightness. Loose connections add loss.
- Verify calibration. Recalibrate if the THROUGH check did not show 0 dB.
- Ensure the measurement cables are not introducing loss that the calibration did not account for.
Passband shape looks asymmetric or distorted
- The filter may actually be asymmetric (some designs are). Compare to the manufacturer’s datasheet.
- Check for impedance mismatch at the ports. A filter designed for 75 ohms will not measure correctly in a 50-ohm system.
Stopband rejection seems limited (e.g., never goes below -50 dB)
- You may be seeing the NanoVNA’s noise floor. This is the instrument’s limitation, not the filter’s. The actual filter rejection may be better than what the display shows.
Next steps
Section titled “Next steps”- Your First S21 Measurement — foundational S21 concepts
- Marker Search — advanced marker search techniques
- Display Formats — other ways to view filter data (group delay, phase)