Testing an Antenna
Testing an antenna with the NanoVNA-F V3 tells you three things: where it resonates, how well it matches your feedline, and what its impedance looks like. This tutorial walks through the full process, from connecting the antenna to interpreting the results.
What you will need
Section titled “What you will need”- NanoVNA-F V3, charged or USB-powered
- SMA calibration kit (OPEN, SHORT, LOAD)
- SMA-JJ RG405 cable (included)
- Adapter from SMA to your antenna’s connector (SMA-to-BNC, SMA-to-SO239, SMA-to-N, etc.)
- The antenna you want to test
Setting up
Section titled “Setting up”-
Determine the expected frequency range.
Every antenna has a design frequency. For amateur radio:
- 80 m band: 3.5 - 4.0 MHz
- 40 m band: 7.0 - 7.3 MHz
- 20 m band: 14.0 - 14.35 MHz
- 2 m band: 144 - 148 MHz
- 70 cm band: 420 - 450 MHz
Set your sweep range to cover the expected band with some margin on each side. For example, for a 2 m antenna, use 130 MHz to 160 MHz.
-
Set the frequency range on the NanoVNA.
Tap the screen, navigate to STIMULUS, and enter the START and STOP frequencies.
-
Calibrate at the antenna connection point.
Connect the SMA-JJ cable (and any adapter you will use for the antenna) to PORT1. Perform a full calibration (OPEN, SHORT, LOAD) at the far end of this cable/adapter assembly. This places the reference plane right where the antenna will connect.
See Full Calibration for the step-by-step procedure.
-
Set up the display.
For antenna testing, two traces are most useful:
- Trace 0: S11 SWR — shows standing wave ratio directly
- Trace 1: S11 SMITH R+jX — shows impedance on the Smith chart
Navigate to DISPLAY > TRACE to configure. You can also use S11 LOGMAG instead of SWR if you prefer to read return loss in dB.
-
Connect the antenna.
Attach the antenna to the calibrated cable/adapter. The sweep updates in real time.
Finding the resonant frequency
Section titled “Finding the resonant frequency”The resonant frequency is where the antenna’s reactance crosses zero — it transitions from capacitive to inductive (or vice versa). On the SWR trace, this is usually near the lowest point.
-
Tap the screen and navigate to MARKER > SELECT > MARKER 1.
-
Tap SEARCH > MINIMUM to jump the marker to the lowest SWR point.
-
Read the marker value. The readout shows the frequency and SWR. On the Smith chart trace, it also shows the impedance (R + jX).
A well-tuned antenna shows:
- SWR below 2.0:1 at the target frequency (below 1.5:1 is excellent)
- Impedance near 50 + j0 ohms on the Smith chart (centered)
- Return loss better than -10 dB (more negative = better match)
Interpreting the Smith chart
Section titled “Interpreting the Smith chart”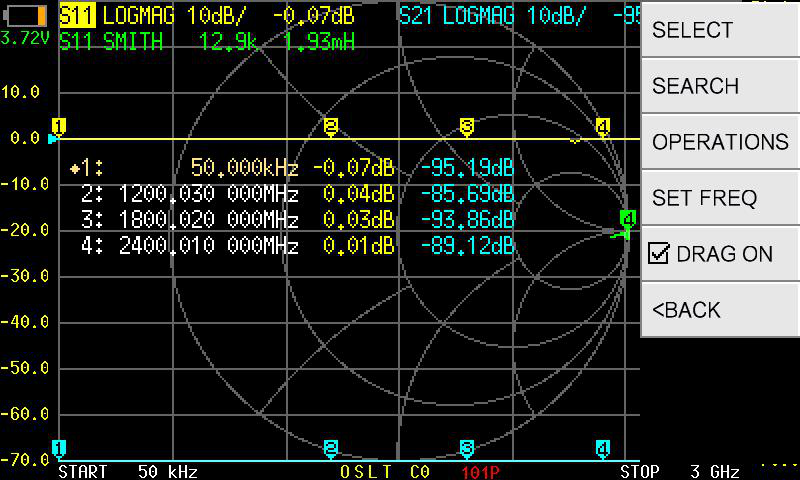
The Smith chart gives you more diagnostic information than SWR alone:
The trace passes through or near the center of the chart (50 ohms) at the design frequency. The SWR dip aligns with the center crossing. No further adjustment is needed.
If the resonant frequency is below the target, the antenna is electrically too long. The Smith chart shows the resonance (real-axis crossing) shifted left of your target frequency. Shortening the antenna element will move resonance upward.
If the resonant frequency is above the target, the antenna is electrically too short. The Smith chart shows the resonance shifted right of your target. Lengthening the element will move resonance downward.
If the trace crosses the real axis but not near 50 ohms (e.g., at 25 ohms or 100 ohms), the antenna resonates at the right frequency but its feedpoint impedance does not match the 50-ohm feedline. A matching network (balun, gamma match, L-network) may be needed.
Tips for different antenna types
Section titled “Tips for different antenna types”Wire dipoles and verticals
Section titled “Wire dipoles and verticals”- Measure with the antenna in its final installed position. Moving a dipole from the bench to the mast changes its impedance.
- Height above ground significantly affects impedance, especially on lower HF bands. A quarter-wave vertical over a ground plane shows approximately 36 ohms at resonance.
- If the SWR curve is too narrow (sharp dip), the antenna may have high Q. This is common with short, loaded antennas.
Yagi and directional antennas
Section titled “Yagi and directional antennas”- The driven element’s impedance is affected by the parasitic elements. Always measure the complete antenna, not just the driven element in isolation.
- Expect the impedance to be lower than a simple dipole — 20 to 35 ohms is typical for a Yagi feedpoint.
VHF/UHF antennas
Section titled “VHF/UHF antennas”- Cable loss matters more at higher frequencies. Keep the cable between the NanoVNA and the antenna as short as practical.
- At UHF (70 cm and above), even a few centimeters of unterminated cable can affect readings. Use quality connectors and adapters.
- The NanoVNA-F V3 covers up to 6 GHz, making it suitable for testing WiFi, 23 cm, and microwave antennas as well.
Recording your results
Section titled “Recording your results”Before disconnecting:
- Note the resonant frequency, SWR at resonance, and impedance values from the marker readout.
- If the antenna covers a band, check SWR at the band edges using additional markers (MARKER 2, MARKER 3). Use MARKER OPERATIONS > >START and >STOP to set markers at the band edges.
- For a permanent record, connect the NanoVNA to a PC running NanoVNA-Saver and capture a screenshot or export the S-parameter data.
Troubleshooting
Section titled “Troubleshooting”SWR is high everywhere (above 5:1 across the entire range)
- Check that the antenna is actually connected. A disconnected cable shows SWR near infinity.
- Verify your calibration is valid. Recalibrate if in doubt.
- The antenna may be completely out of the measurement range. Try widening the span.
SWR dip is at the wrong frequency
- The antenna length needs adjustment. Shorter elements resonate higher, longer elements resonate lower.
- Nearby objects (metal structures, other antennas, your hand) detune the antenna. Keep clear during measurements.
Smith chart shows a tight circle that does not cross the real axis
- The antenna may not be resonant in the displayed range. Widen the frequency span.
- There may be a feedline problem (damaged cable, bad connector) preventing the signal from reaching the antenna.
Next steps
Section titled “Next steps”- Your First S11 Measurement — foundational S11 concepts
- Full Calibration — detailed calibration procedure
- Using Markers — advanced marker techniques for band-edge measurements